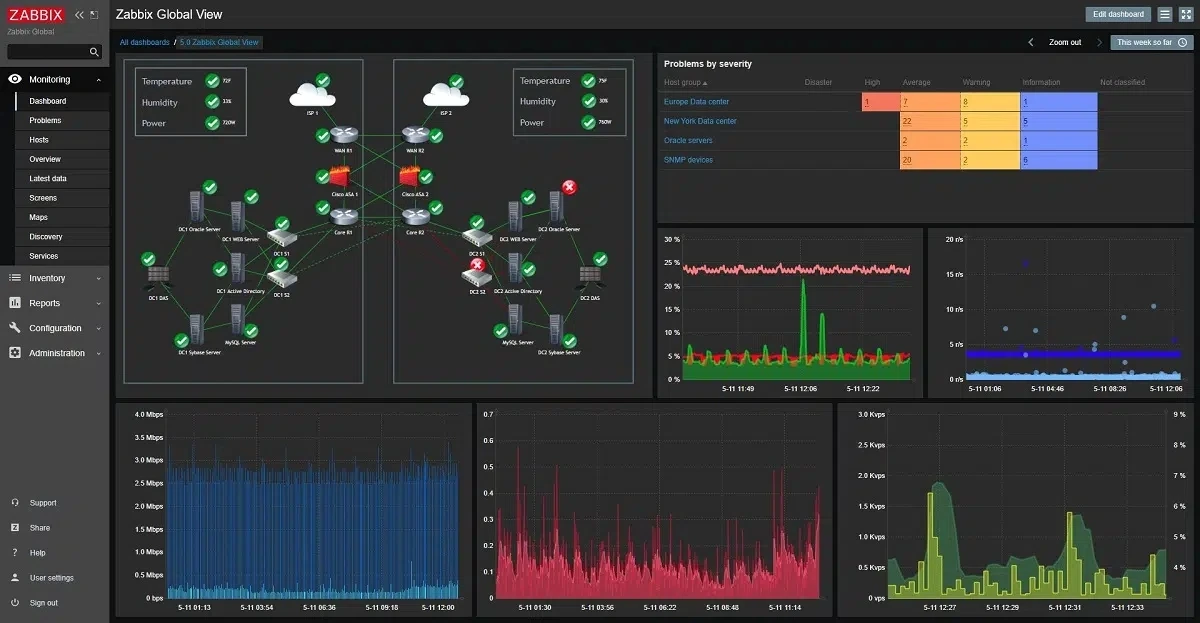
A continuous view of your IT infrastructure health
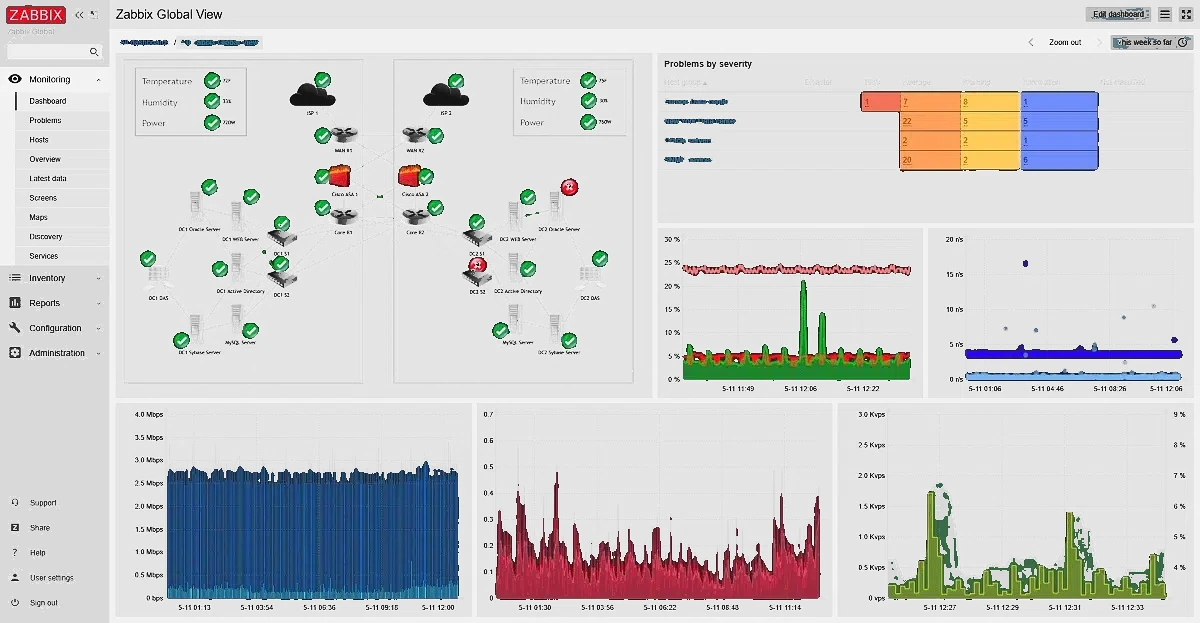
We implement Zabbix as a central infrastructure monitoring system. Servers, networks, virtualisation, NAS, applications and services are brought into one environment with clear dashboards, metric history and alerts that help react before a small anomaly becomes an outage.
OPEN SOURCESNMPSERVERSNETWORKPROXMOXALERTS
ZABBIX / INFRASTRUCTURE MONITORING
MONITORING: ACTIVEALERTS: READY ›
02 ZABBIX / OVERVIEW
Monitoring that shows what is really happening in IT
Zabbix is an open-source platform for infrastructure monitoring and observability. KTS designs the deployment around the actual environment: data sources, templates, thresholds, dashboards and alerting are selected for the organisation.
NO PER-DEVICE LICENCEZabbix is open source, so the monitoring scope is not limited by the number of sensors or devices.ONE CONTROL POINTA shared view for servers, networks, virtualisation, services and infrastructure components.HISTORY AND TRENDSCharts help analyse load, availability and plan future infrastructure growth.
03 MONITORING SCOPE
What we can monitor
01
Windows and Linux servers
CPU, memory, disks, services, processes, logs and system availability.
02
Network and devices
Routers, switches, firewalls, Wi‑Fi and links, including monitoring via SNMP.
03
Virtualisation and cloud
Hosts and virtual machines, including Proxmox environments and resources available through APIs.
04
NAS, backup and certificates
Array status, free space, selected backup jobs and certificate expiry dates.
05
Applications and services
HTTP/HTTPS, databases, mail, APIs and key business services.
06
Server room and power
UPS units, temperature, selected sensors and technical devices.
04 IMPLEMENTATION
Implementation without unnecessary complexity
01
INVENTORY
We define what to monitor, which data matters and who should receive alerts.
02
INSTALLATION
We deploy the Zabbix server and configure secure communication with the monitored environment.
03
AGENT / SNMP / API
We connect servers and devices, choose templates and appropriate data collection methods.
04
THRESHOLDS & ALERTS
We configure meaningful thresholds, priorities and notification channels without alert noise.
05
DASHBOARDS
We build clear operational and reporting views and tune monitoring after go-live.
05 OBSERVABILITY
Information before users report an outage
KTS SOFTWARE
Less downtime
Early detection of resource, service or connectivity problems shortens response time.
KTS SOFTWARE
Faster diagnostics
Metric history shows what happened before an incident and helps identify the root cause.
KTS SOFTWARE
Data-based planning
Capacity trends help plan upgrades before performance becomes a problem.
KTS SOFTWARE
Audit support
Availability and event history improve infrastructure documentation and operational evidence.
06 FAQ
Frequently asked questions about Zabbix
Is Zabbix paid software?
Zabbix is open source. Costs relate to design, implementation, infrastructure and optional ongoing support.
Does Zabbix only monitor servers?
No. It can also collect data from network devices, virtualisation, NAS, UPS, applications, services and many other infrastructure components.
Can you improve an existing Zabbix installation?
Yes. We can review an existing setup, clean up templates, triggers, thresholds and dashboards, and reduce unnecessary alerts.
07 KTS SOFTWARE
Want to see your infrastructure in one place?
We will tailor Zabbix to your network, servers, services and IT operating model.